- Spring 2025
Differences in Lab vs. Plant Mixtures Using IDEAL-CT
Many DOTs are considering BMD to assess the resistance of asphalt mixtures to common distresses. In order to implement BMD testing as part of quality assurance (QA) during project construction, several issues need to be settled. One of those issues is observed differences in BMD test results between laboratory-prepared mixtures and plant-produced mixtures. Potential causes of the differences include changes in mixture components during plant production, shifts in aggregate gradation, changes in asphalt content, changes in the asphalt binder supplier or sources, differences between lab and plant mixing and aging conditions, storage time, and the use of different laboratories and technicians. Although numerous studies have shown that BMD tests are sensitive to specimen fabrication procedures, few standards or published guidelines have existed until recently regarding the preparation of mixtures and specimen fabrication, particularly in dealing with the reheating of mixtures.
In an effort to understand the causes of differences that can exist between lab-prepared and plant-produced mixtures, NCAT researchers examined information from over 100 mixtures from 10 sources across the U.S. The analysis was limited to Indirect Tensile Asphalt Cracking Test (IDEAL-CT) results since it is the most widely used BMD cracking test. For each mix design, the average CTindex and mixture components (i.e., binder content and aggregate gradation) of laboratory-designed and plant-produced mixtures were collected. Volumetric properties and the high-temperature performance grade (HPG) of extracted binder were also collected if available.
Table 1 summarizes the number of mix designs, and the aging conditions used for laboratory-designed and plant-produced mixtures for each source. Three short-term oven aging (STOA) procedures were used to prepare laboratory-mixed laboratory-compacted (LMLC) specimens including 2-hour@275°F, 4-hour@275°F, and 4-hour@compaction temperature. Plant-mixed laboratory-compacted (PMLC) specimens were fabricated either during production (i.e., hot-compacted) or after reheating (RH).
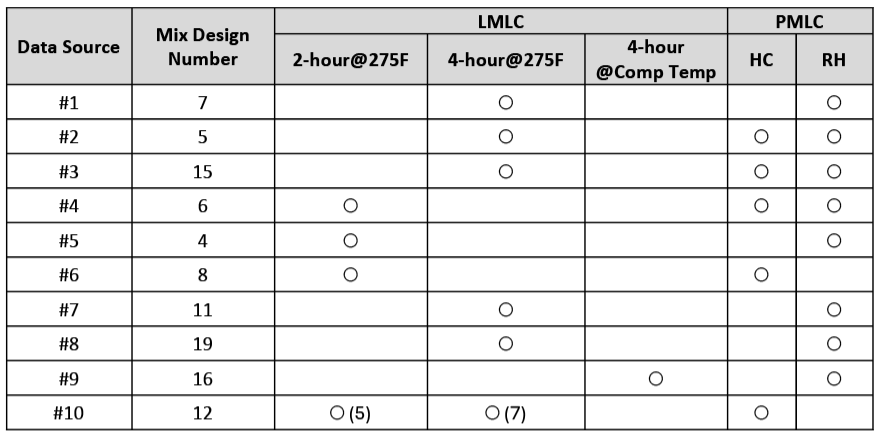
Table 1. Summary of Mix Design Number and Aging Conditions
Analysis was conducted in two parts. Part 1 compared the CTindex between laboratory-designed and plant-produced mixtures under various aging conditions. Part 2 sought to identify the potential causes for the differences by examining the change in CTindex (ΔCTindex) in relation to changes in mixture components (binder content and passing percentage of each sieve), volumetric properties (VMA and Va), and binder quality (HPG).
Figure 1 compares CTindex results of HC-PMLC to LMLC specimens. As shown in Figure 1(a), the LMLC specimens compacted after the 2-hour STOA procedure from Lab 2 compared very closely to the HC-PMLC results, but the LMLC specimens compacted after the 2-hour STOA procedure from Lab 1 yielded higher CTindex results compared to the corresponding HC-PMLC results. As shown in Figure 1(b), the LMLC specimens compacted after the 4-hour STOA procedure compared were scattered more evenly around the line of equality, indicating that the 4-hour STOA procedure may be more representative of the aging that occurs through plants.
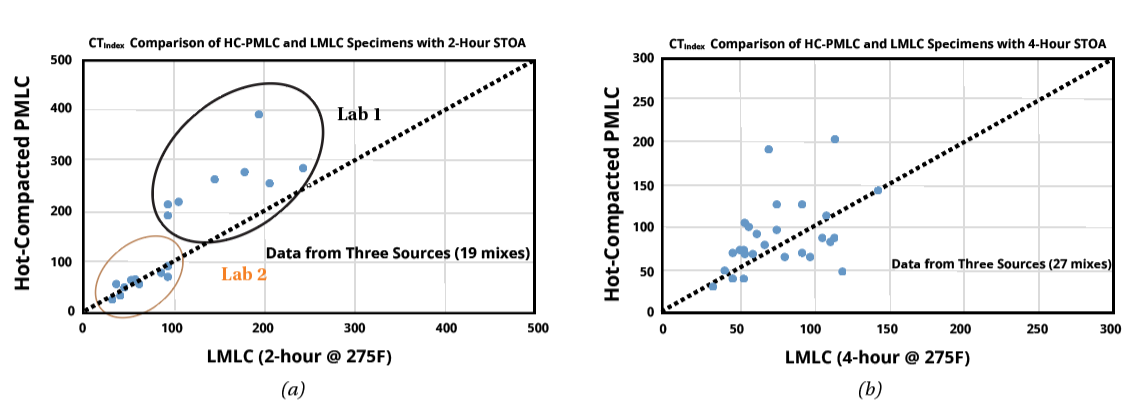
Figure 1. HC-PMLC Vs. LMLC; (a) LMLC (2-hour @275F); (b) LMLC (4-hour @ 275F)
Figure 2 shows the comparison of CTindex results from LMLC and RH-PMLC specimens. As shown in Figure 2(a), the RH-PMLC specimens had lower CTindex results than the corresponding LMLC specimens using aging protocol of 2-hour@275°F, indicating that the 2-hour@275°F aging protocol was insufficient to replicate the aging of reheated plant-produced mixtures. However, as shown in Figure 2(b), the 4-hour@275°F protocol produced more comparable aging and results as the reheated plant-produced mixtures, as indicated by the linear trend line and regression equation.
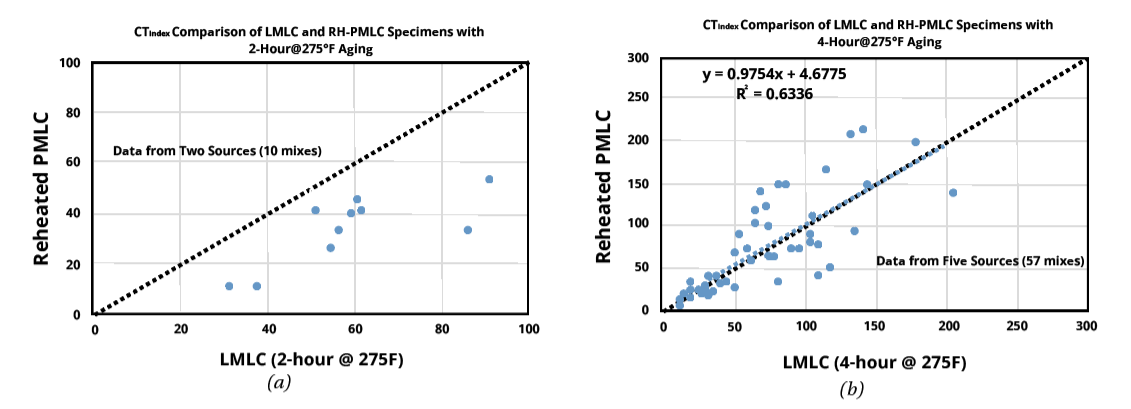
Figure 2. RH-PMLC Vs. LMLC; (a) LMLC (2-hour @275F); (b) LMLC (4-hour @ 275F)
Part 2 of the analysis sought to identify the potential causes for the differences between laboratory-designed and plant-produced mixtures. The change in CTindex (ΔCTindex) was plotted against the change of mixture components (binder content and passing percentage of each sieve), volumetric properties (VMA and Va), and binder quality (HPG). For example, CTindex is known to be sensitive to a mixture’s asphalt content. As shown in Figure 3 (a), the ΔCTindex was plotted against the change of binder content (ΔPb) for RH-PMLC and LMLC (4-hour@275°F). For this data set, the ΔPb ranged from -0.7% to 0.5% and the ΔCTindex ranged from -80 to 65. The graph shows there was no correlation between ΔCTindex and ΔPb. Similar observations were made when plotting ΔCTindex to the change of other parameters, including the passing percentage of each sieve and volumetric properties, regardless of the mixture aging conditions.
However, as shown in Figure 3 (b), a negative linear correlation was observed between ΔCTindex and ΔHPG, which indicates that the difference in CTindex between laboratory-prepared and plant-produced mixtures was partially caused by the differences in binder aging. Differences in CTindex results between lab-prepared and plant-produced asphalt mixtures are most likely attributed to variations in aging conditions — specifically, short-term oven aging of lab specimens, binder aging during plant production, and additional aging from reheating plant-produced mixtures. Based on available data, the 4-hour STOA procedure appears to most closely represent the aging observed during production. To ensure consistency, it is important to minimize further aging during reheating of plant-produced samples.
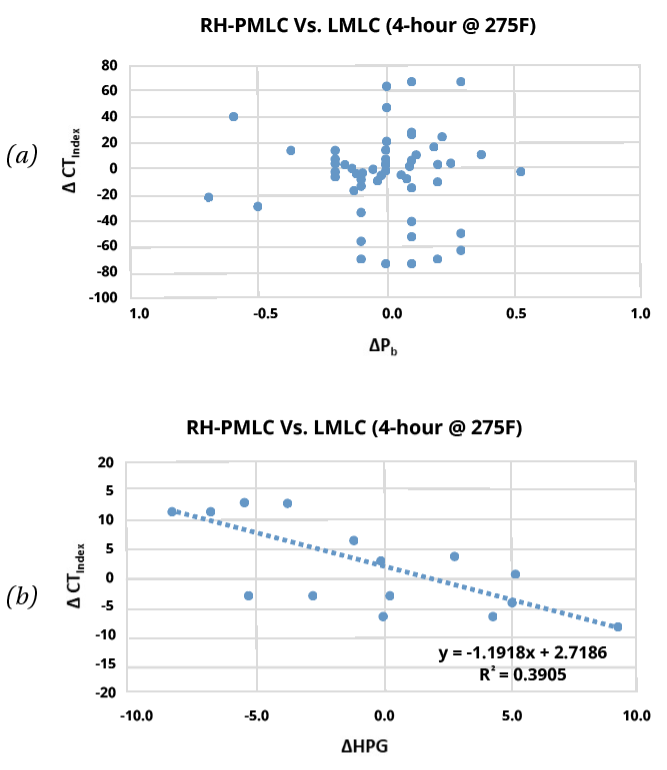
Figure 3. Correlations between ΔCTindex with the Change of Mixture Components; (a) ΔCTindex Vs. ΔPb; (b) ΔCTindex Vs. ΔHPG


Contact Chen Chen or Carolina Rodezno for more information about this research.