ESMD Course Material : Fundamentals of Lunar and
Systems Engineering for Senior Project Teams, with Application to a
Lunar Excavator
Contact: David Beale, dbeale@eng.auburn.edu
Contact: David Beale, dbeale@eng.auburn.edu
|
|
Chapter 4: System Engineering ToolsBy David Beale and Joseph Bonometti
This chapter is meant to provide supplemental examples of application of systems engineering tools which may be needed during the SE design process by a student team. It is certainly not all inclusive of the breadth and sophistication of the available tools in the industry. What is presented here are some core tools, some basic and simplified for easy application to a student project. It is a good time to reinforce the idea of the art of Systems Engineering as compared to the artist’s “tools”. Practice, understanding, maintenance, and tailoring of any tool set is necessary in all professions, but if the tools become the object of the art, or the end goal in itself, it has failed its master. In today’s technical and highly complicated aerospace field, the danger is the overuse and reliance upon the SE tools to produce a successful product in the eyes of the customer. Only sound engineering and good judgment will triumph in that regard, while over reliance of “the process” only serves to make a slave of the systems engineer and obscure the critical impediment to success through overly strict attention toward filling out documents, making deadlines, adding up budgets and presenting insipid data. Therefore apply the tools with the intent that they serve to:
Do not treat the tools as:
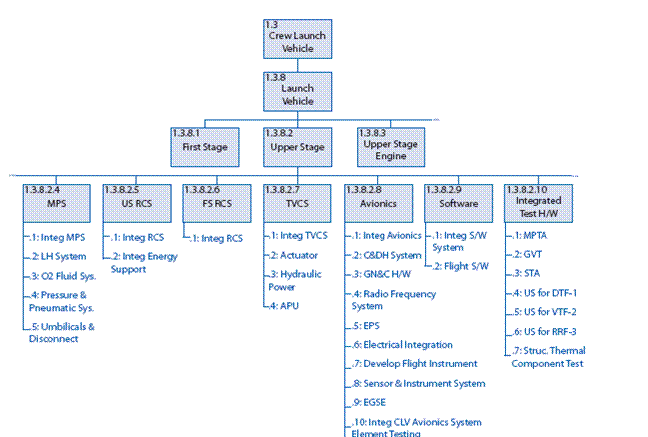
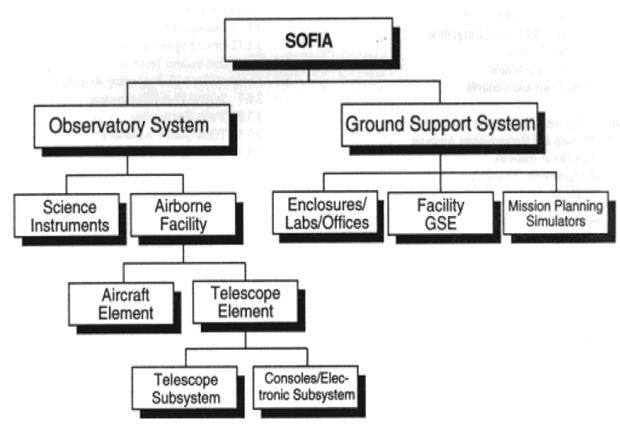
Table 1. Systems Engineering Tools. *Other tools are applicable for Architectural Design but not presented in this Chapter, such as functional analysis or functional decomposition (see example in Chapter 2), decision matrices, House of Quality, in addition to software simulation (see example in Chapter 8), prototyping and modeling. Product Breakdown Structure (PBS)A product breakdown structure (PBS) is a hierarchical breakdown of the hardware and software products of the project. It is created as part of the SE architectural design function. The following example (Figure 1) comes from (NASA, 2007). These can be created in PowerPoint using the Insert > Diagram > Organizational Chart. Some discretion can be used to combine blocks (most often for smaller projects), or add specificity to others. The PBS communicates the areas to be worked and supports task assignments, budgeting and other SE tool development. For the SOFIA project (Figure 2), the two major subsystems are the Observatory System and the Ground System.
Figure 1. NASA Product Breakdown Structure (PBS) for a launch vehicle
Figure 2.
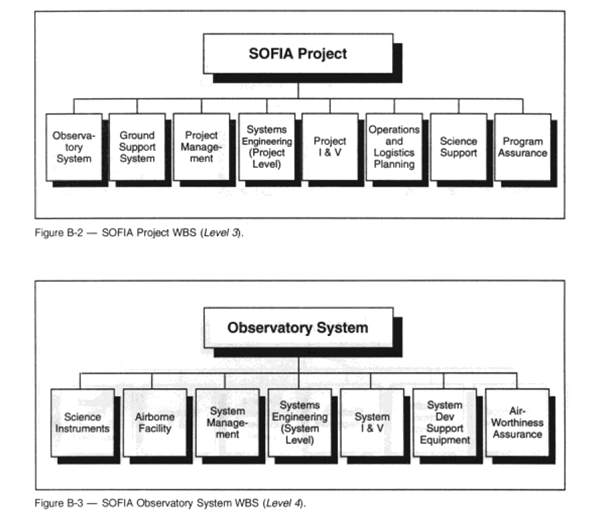
PBS example for the Work Breakdown Structure (WBS)Figure 3 show a Work Breakdown Structure or WBS (a hierarchical division of hardware, software, services and data) for the SOFIA example system of Figure 2. The WBS is a tree of subdivided efforts to achieve the end objective, it should include all work functions. Additional work functions on the WBS not found in a PBS include Project Management, Systems Engineering, etc. (from (NASA, 1995)). The WBS also adds in preparing cost estimates, manpower requirements, etc. This document, like all SE tools, is tailored to the suit the project. It should be useful and applicable to the job and not simply a copy of “the last project’s package” to include in the next review or briefing. A good rule to use with all SE tools: if it has no function to support the project, it should not be used. In the case of small student projects, the learning objective may make the inclusion of otherwise questionable process tools and tracking very important. Furthermore, student projects that are passed from one class or group of students to another make clear documentation through Configuration Management a greater necessity.
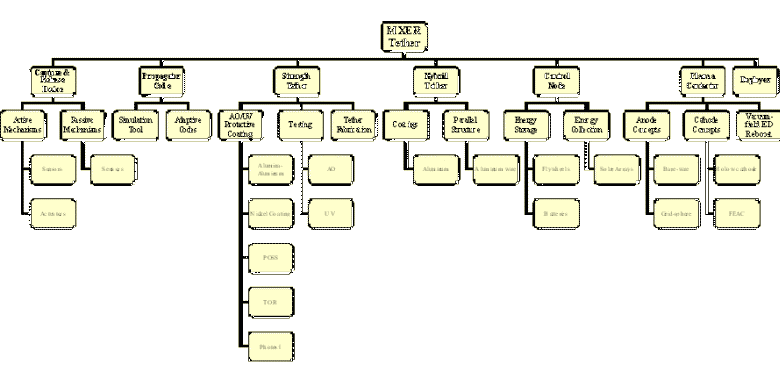
Figure 3. SOFIA Project highest-level WBS, and the details of the Observatory System WBS. The WBS includes many of the same elements as the PBS but adds such things as the management, safety, reliability or other significant oversight activities. It may be thought of as “people” derived components whereas the PBS is more the “things” that comprise the project. Again, the purpose is to communicate the complexity and nature of the project, to stimulate the design and engineering process and to prevent obvious omissions or duplications. This next WBS is an example of how a traditional WBS can be set up for an unusual or advanced systems engineering task. The Momentum Exchange Electrodynamic Reboost (MXER) system is a 100 km space tether that can pick up a satellite and toss it on a trajectory to GEO, the moon, or interplanetary space. It is reboosted by pushing on the Earth's magnetic field and can be ready to impart momentum to the next satellite launched to LEO. Note how its unique components and needs are captured in the WBS. The “Propagator Code” is a separate computer algorithm that predicts where the tether end will be at rendezvous. Because this was a key factor to the design, control and operations it was a top-level area to be worked. It could have been included as a lower tier item in a traditional avionics or spacecraft control area, but in this technology development project it was best served in breaking it out at the top. How does one know when to do that? That is the art of Systems Engineering! Experience, engineering intuition and consultation with design team members are the typical ways one makes that judgment. It should never be based on the last project’s documentation because it is easy to “cut and paste” and move on to the next SE tool.
Figure 4. MXER (Momentum Exchange Electrodynamic Reboost) Tether Work Breakdown Structure A WBS does not have to be a hierarchical chart. See the WBS example in Chapter 2 which is based on a Gantt Chart and a WBS outline structure using MS-Project. Trade StudiesA trade study is a tool used to help choose a solution to a problem or to bound the development area for a particular project. They are often used early on in the product development cycle and, if used properly, can be one of the most important engineering tasks in the life cycle of a product. In highly sophisticated projects, or the design of “systems-of-systems,” the trade study is often very complex, with engineering details approaching the actual design process in some areas. These studies are also extremely important in defining and illuminating what factors are truly the most influential to the success of the work. The most surprising outcomes should originate in these early (Phase A or B) trade studies, if not, the surprises will come at the end of a project where the time and money required to make a change is excessive. If a problem has multiple solutions, a trade study will rank the solutions by giving each solution a numerical value. A simple method is to determine a numerical value for each option. This is often done based on weight factors and a normalization scale for the evaluation criteria. Evaluation criteria are important factors that we want to include in the trade study. Weight factors are used to dictate how important the evaluation criteria are relative to each other. The normalization scale creates a constant interval scale that allows us to set a numerical value for each of the evaluation criteria. Cost, mass, volume, power consumption, legacy, and ease of use are some basic evaluation criteria (note, depending on the project an additional criteria may be desirable to add, or eliminating one listed here conceivably could be appropriate). It is also very important to understand that the choice of weight factors and normalization scale are extremely important to this process. A great deal of care must be taken when setting these values, because the result can be highly sensitive to the intentional or unintentional bias. For example if one lists cost of insurance when buying a car along with initial purchase price as evaluation criteria, but adds a weighing factor to the insurance much higher than the purchase price, the ranking results of the different car options are markedly different. When the insurance is much less than the purchase price and varies only slightly among the various cars, the results will not yield the best value if what you truly desire is low overall lifecycle cost or the lowest cost per mile. In some very close trade spaces, the desire maybe to distinguish among various options and a tier weighing scale can be employed (i.e., a weighting scale of 1, 3 and 9 for example). This intentionally inflates the small distinctions among options so that a clear “winner” can be determined. Such schemes should be used extremely carefully and only when options are truly impossible to differentiate. Simplified Trade Study Steps1. Define the problem. 2. Define constraints on the solutions. 3. Find 3-5 solutions 4. Define evaluation criteria. 5. Define weight factors 6. Define normalization scale 7. Fill out trade study (e.g., spreadsheet format) 8. Rank the solutions Trade Study Example – Purchasing a Car (from J-M Wersinger and Thor Wilson)Based on the steps listed above: 1. I want to find what is the best option for a new car. 2. The car must be less than $50,000 and it must be local. 3. A black Civic with 37,000 miles and cost $4,000 in poor condition. A red BMW with 57,000 miles and cost $17,000 in excellent condition. A white Passat with 6,000 miles and cost $7,000 in good condition. 4. Cost, mileage, condition of the car, and color of the car. 5. Assign a weight factor of 3 for cost and condition of the car, 2 for mileage, and 1 for color of the car. 6. Normalization scales:
Cost (in $1,000)
Mileage (in 10,000)
Steps 7 & 8:
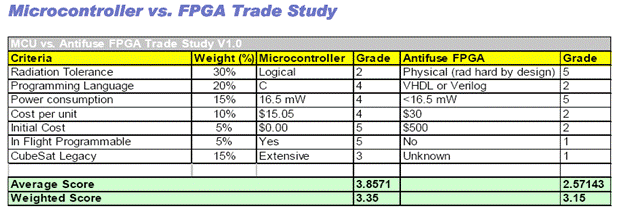
Table 2. Trade study example Trade Study Example – Comparison of Microcontrollers for CubeSat (AUSSP, 2007)
Table 3. Trade study example, microcontroller versus FPGA This is a trade study conducted by the C&DH subsystem team to evaluate the relative strengths and weaknesses of standard 8 bit microcontrollers and Antifuse (one-time programmable ) FPGAs (Field Programmable Gate Arrays) in CubeSat applications. While microcontrollers have been used extensively in CubeSat applications, FPGAs are a relatively new technology that may provide a solution to radiation induced single event upsets (SEUs), common in a sun synchronous low earth orbit. Evaluating criteria were chosen such that the trade would compare not a specific piece of hardware from each category, but rather the essential traits of any piece of hardware from each category. Result: The inherent radiation tolerance of any piece of hardware implemented on a CubeSat is a feature of critical importance. While Antifuse FPGAs appeared to be a solution for SEUs in small satellites, they did not score higher than the more traditional microcontrollers in the trade study. When performance, cost, time, and the scope of implementing each system are compared, FPGAs seem to take only the performance category, with microcontrollers sweeping the others. Even with radiation tolerance at 30% of the total weighted score (an example of biasing the analysis to check for robustness of the result), FPGAs surprisingly trail microcontrollers. Undoubtedly, this type of trade study will have very different results for missions with more resources, more time, and more experienced engineers. However it appears that the correct route is to implement a standard microcontroller, coupled with logical SEU detection and correction algorithms. This was a subsystem comparison that did not consider systems engineering implications for other subsystems, which would have further solidified the standard programmable controller. With only one set of instructions capable of being implemented, the quality and reliability of all the controlled subsystems would be heightened. These other subsystems would have to lock in technology decisions earlier and have less ability to correct issues through software changes. From a systems engineering (or project management) point of view a greater number of SEUs, additional mass in shielding, or more effort in component layout (takes advantage of shielding effect of tanks, structures, etc.) are all acceptable compromises to an inflexible but radiation harden C&DH subsystem. Interface Control Document ExamplesInterface Control Documents (ICD) are inherently simple in the fact they record all the places where it is easy (and past experience has proven) to miscommunicate technical specifications and requirements among subsystem teams. Misaligned bolt holes or missing connector pins are costly to fix when final assembly is being made and the project is a few weeks behind schedule in meeting a fixed launch date. The document is another place to double check voltages, fluid flow rates, thermal loads, etc. to ensure compliance to standards and higher-level requirements. The ICD also can help account for the “missing mass” never planned for in the form of wiring, brackets and miscellaneous hardware required in a real working assembly, since rarely are all system components connected end to end. ICD is not only documentation, but also, hardware designed to check fit and test actual components throughout the development. This is especially helpful in large projects with components and subsystem being developed around the world. Instead of physically putting together parts, an interface hardware model is constructed and tested separately on each part, without impacting either group’s schedule or development process. ICDs apply to ground equipment and wireless communications as well. Anywhere the need to document separate functions that will ultimately interconnect, an ICD can be developed. A wide variety of document forms are show in the following examples. Tables or spreadsheet formats are common but ICDs can include technical documents, pictures, hardware, graphs and specification references. The systems engineer is responsible for keeping the ICD current and accurate. Subsystem leads will often blindly apply what they have last received as the specifications to which they are designing and building to. Therefore the system engineer must ensure every team gets each and every change update and that conflicts are resolved early in the design phase. There is also the need to ensure layout room, mass, thermal contact, physical rigidity and electrical/data parameters are satisfactory for all subsystems as well as the mission objectives.
Table 4. Example Interface Control Document
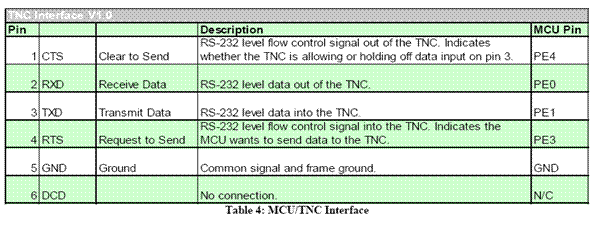
Table 5. MCU/TNC interface.
Table 6. Example Interface Control Document BudgetsMass Budget ExamplesFor aerospace applications, the mass budget spreadsheet is the icon of the system engineer’s toolbox. Because minimizing mass is so critical in aircraft, rocket and spacecraft design, the bottom-line number here is often the most monitored and distressing result in SE. Although of great importance, the mass budget is simple to set up and use. Unfortunately, it is often poorly estimated and certainly the most abused SE tool. Mass is critical, therefore even small errors can lead to big problems in aerospace. A 30% margin is generally added for preliminary mass estimates with more than 50% added to systems or subsystems that are new or have unique technology. Even a spacecraft that is a duplicate of a previous mission will carry as much as a 10% margin, since each mission has unique environments and almost any requirement modification will translate into a mass penalty. Some things are best not burdened with a flat mass margin such as propellants. Such fluids tend to be heavy and normally well known from the trajectory analysis and other factors. In the case of a heavy radiation shield, which is significantly massive, but essentially “dumb mass”, 2% or less margin might be applied. The systems engineer should not be the clerk or secretary that enters whatever value the subsystems leads produce and then announce the grand total to the team. There is judgment in producing an initial gross mass, assigning a maximum mass allowance for each subsystem and giving guidance on contingency at the part, component or system levels. The total should meet the other mission level criteria such as the launch vehicle limit, the planned payload, or a cost target based on mass. Determining if more advanced technology is required, or reallocation of the mass estimate takes engineering insight. The systems engineer must serve as the “honest broker” to direct the best overall decisions for the team and to work through the inevitable conflict among subsystems.
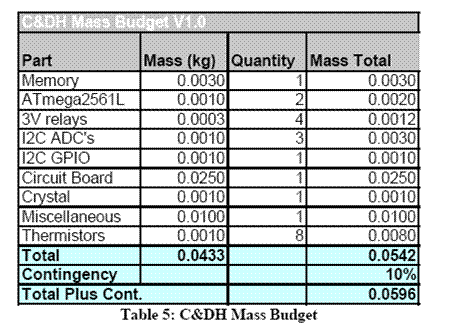
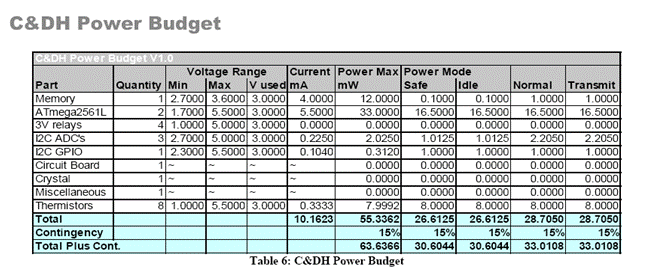
Table 7. C&DH mass budget example Power Budget ExamplesPower budgets are often kept at the subsystem level for convenience, but this is really a systems engineer’s function and concern as much as the mass budget. There are trades made among subsystems, technology selections and the integration of mission operations. There are two key power budgets; the total power (everything thing on) and the operational limits (peak power allowed). Many times the power budget will restrict certain functions and limit operational modes. Transmitting data often is a power intensive task and is limited to certain periods of the mission when other subsystems are shutdown or in idle mode. Earth orbiting satellites will have period of darkness where solar panels no longer provide power and batteries must be reserved for heating crucial spacecraft components. Such trades and operations decisions are at a SE level, even when the power budget is maintained by a single subsystem lead. In the C&DH budget example below, several power modes or states are listed. Each has its own permissible upper or lower limit and each are accounted for separately. These states correspond to the mission modes and timeline.
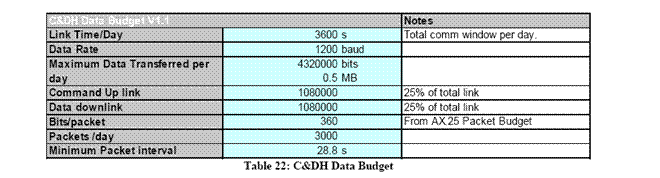
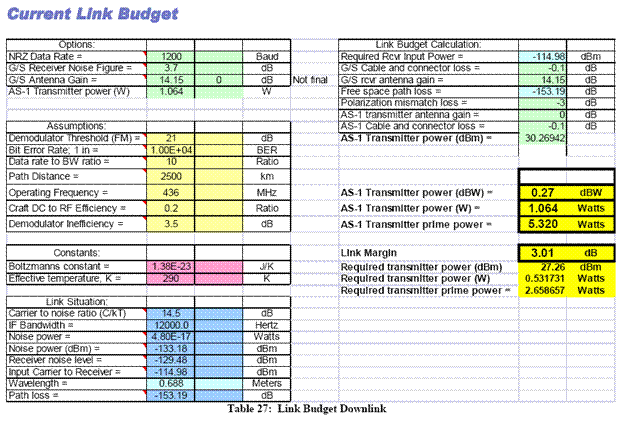
Table 8. C&DH Power Budget example Data and Link Budget ExamplesLike the power budget, the data and link budgets are often maintained by a subsystem lead, with the responsibility of overall coordination still left at the systems engineer level. The data budget is derived from the time available for communications and the baud rate. There are usually two rates and often two separate systems; one for the uplink or communications to the system, and another for the downlink of data being sent to the ground station. There are many factors to account for and engineering judgment is necessary when making these estimates. The quality of the data, its resolution, error checking, package size and similar criteria are typical tracked parameters in the data and link budget.
Table 9. C&DH data budget example
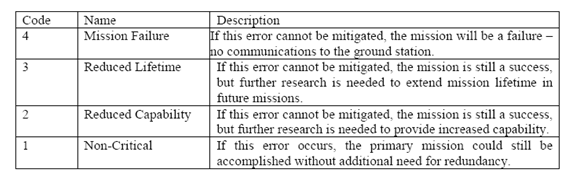
Table 10. Link budget example Failure Mode AnalysisFailure mode analysis is a tool for risk management. It is the more rigorous engineering or technical aspect of risk management. A failure mode is the way in which something fails. Every failure has one or more consequences, which are called the failure effects. A failure cause is what induces the failure. After identification of all possible failures the effects of the failure are estimated. Next a mitigation plan is prepared for each potential failure cause. Failure Modes Analysis on the CubeSathttp://space.auburn.edu/page_attachments/0000/0046/Spring_2008.pdf Because the cubesat project does not have the funds or the available space to mitigate every potential failure, the system must be redundant, fault tolerant, and able to correct detected errors. Failure Modes Analysis is done to determine what the potential failures are in a design and how to mitigate them. This analysis determines the relation between the failure of a single component and its effects on the system as a whole. We accept that no system is perfect, and so some risks are acceptable. Therefore, mitigation attempts will be focused on those failures, which might cause mission failure. In most cases, a secondary component can be used to mitigate any mission failure. The table immediately following shows the four different ways a component failure can affect the whole system.
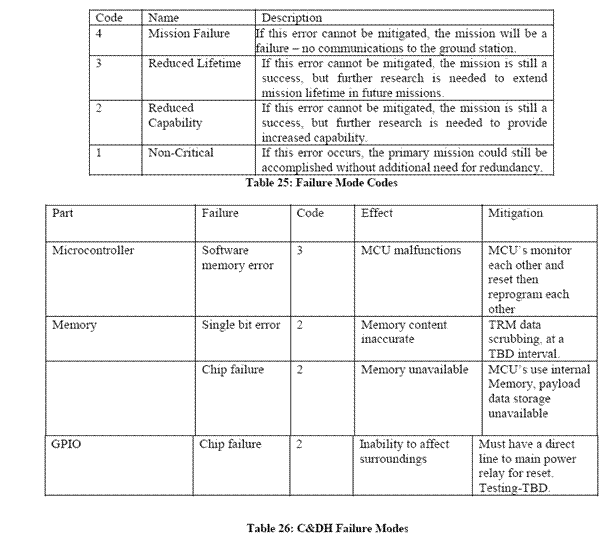
Table 11. Failure Mode Analysis, Codes of Severity of a Potential Failure Identified Single Point FailuresA single point failure occurs if the mission fails as a result of a single component on the satellite failing. Simply put, it is hardware that the satellite cannot operate without. It is extremely important to detect and eliminate all single point failures that could arise on AS-I. In an effort to eliminate single point failures, a redundancy philosophy has been adopted. The redundancy philosophy states that all satellite hardware identified as single point failure components must have redundant (secondary) hardware. Generally having redundant hardware means simply having two of the same component where they operate independently. A common variation to this theme of “if it fails, use the other one”, is the hot spare where the second component is active and functioning and continually ready to operate at any moment. Sometimes the units are regularly swapped as the primary unit for other reasons, such as to support battery lifetime or prevent joint seizing in mechanisms. Other redundancy philosophies include having a totally different piece of hardware as the backup. This may be a low gain antenna serving the housekeeping needs and a high gain antenna for the mission science. However, if one fails the other can perform the same duty, but with diminished total data throughput. As with most aerospace related redundancy schemes, this provides a significant mass savings over having two of both types of communications systems onboard. Another mass saving method is to identify the actual weak point in the subsystem and make the redundancy at the component or part level. A good example is in rocket fluid valves where the valve housing is the heaviest and least likely part to fail. In the past, welding in a second complete valve inline or in parallel was the solution. However, since the failure is almost always in the valve seat (e.g., not closing tight), redundancy can be achieved in duplicating the seat seals and in dual electromagnet actuating coils. This not only saves the mass of a valve housing, but also the cost and risk of two more welds in the system. Redundancy also can be in de-rating components to ensure they last the mission lifetime or in adding margin to a subsystem so if it's redundant part fails, it can “ramp up” to higher performance and diminish or eliminate the loss. A spacecraft power conversion box or transformer might operate as two low-power units supplying the primary instrument high voltage, thus gaining long life with lower risk, but each having the capacity to meet the entire voltage requirement (or the minimum for mission success) should the other component fail. Details on the AS-I redundancy choices for the single point failures are given in each of the subsystem’s documentation. The following components have been identified as single point failure components in the CubeSat: Power Storage (Li-ion batteries) Pulse Charger Transceiver TNC Microcontroller Example Failure Mode Analysis – COMM System, C&DH System and Stuctures
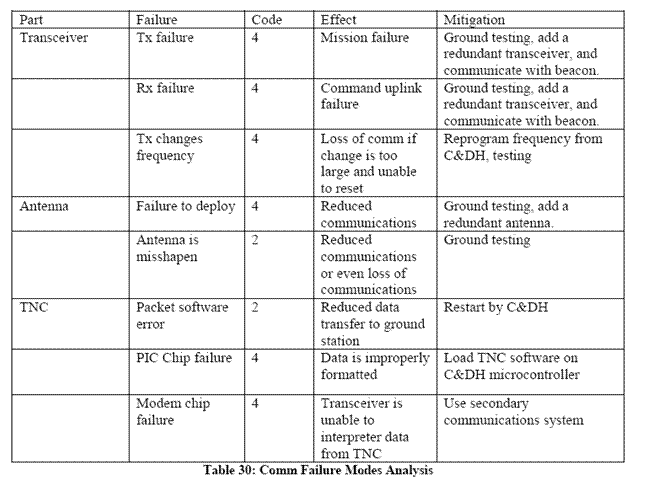
Table 12. Failure mode analysis for Comm system
Table 13. Failure mode analysis for C&DH system
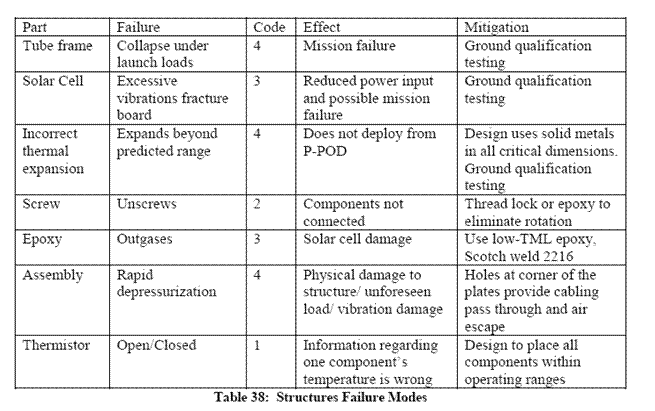
Table 14. Failure mode analysis for Structures system Gantt ChartA Gantt Chart is a bar chart that can be used to allot time to tasks, schedule reviews, and date milestones. Tasks are the project activities. Tasks have start and end dates (e.g. “Create Structure”). Generally we write the task as a phrase starting with a verb (e.g. “creating product”). Each task has a start time and end time. The chart often needs to be updated since end dates are usually estimates and tend to slide (almost always later than earlier in real practice). Milestones are either checkpoints, due dates, dates for interim goals, or dates of reviews. Since the chart period is usually set in days, weeks, or months, meetings, reviews and milestones appear as single dots or bullets rather than a line for how long the item takes. See Chapter 2 for other examples. The Gantt Chart is typically one of those SE “tools” that can make the slave of its master in real practice. If you knew exactly what tasks were needed, precisely how long each task really took and the proper order they would be done in, then the Gantt Chart could be properly used as a true gage of the engineering progress. If the real progress was ahead of the Gantt Chart, the team could be assumed exceptional and be given time off. If they were behind, they needed to stay late and get back on track. But that all assumes the chart indicates the true process. Only in rare circumstance is there sufficient information to get even a slightly accurate schedule laid out at the beginning of a technical project. Besides not knowing the design and what might be needed to integrate all the subsystems, things outside the project control are guaranteed to mess up the planning. Typical for aerospace projects are the funding availability (money must be there to hire engineers or pay the contractor), the procurement process (how long it takes to buy something), facility access (testing is often rescheduled due to other projects using a facility) and numerous technical issues. This “measuring stick” of project’s progress is not a precise yardstick that can be used to beat subsystem leads into doing their work! It is more accurately described as a loosely laid out bungee cord to which different people pick up at various points, each effecting the length and alignment of the rather inaccurately spaced measurement marks. Use the chart as a tool to help monitor and roughly gauge where a project stands. It is better than not having any idea of the task timing and it does make the system engineer aware of conflicts and product integration flow. Nonetheless, you could have the most exceptional engineering team that is far behind the original schedule with added tasks and missed milestones and the sorriest group of misfits right on the Gantt Chart schedule. You probably would still prefer to ride in the rocket the first group produced late, than launch on time with the second.
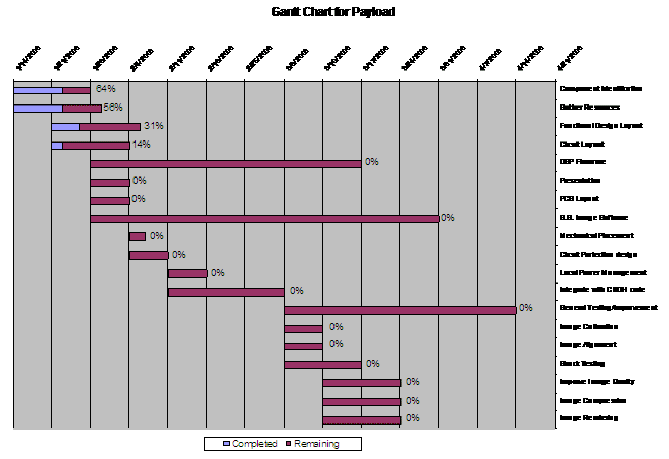
Figure 5. Gantt Chart showing schedule of tasks and their progress. Outline of a Detailed Systems Engineering Management Plan (SEMP) for a Student Project (NASA, 2002)The SEMP is a planning document that should be baselined by the Systems Engineer at the end of Phase A, and formally updated as needed thereafter. It primarily schedules activities and reviews, and assigns SE functions to individuals. The level of detail necessary here depends on the size of the team, scope of the project, etc. with the primary sections listed as follows: 1. Introduction
(Include 2. System Engineering Activities (Describe the overall lifecycle including the major systems engineering activities for each phase, irrespective of who does them. Describe critical decisions and activities such as Reviews.) 3. Communication (Describe methods utilized for communicating systems engineering activities, progress, status and results.) 4. Systems Engineering Functions
4.1 (The Systems Engineer should be responsible for creating a team who are responsible for Level 1 Requirements and Mission Objectives.) 4.2 Operations Concept Development (The Systems Engineer defines who develops the operations concept, what format is planned and when it is due. Define who develops the ground based verification concept, what format is planned and when it is due.) 4.3 Mission Architecture and Design Development (Define who develops the Architecture and Design, what format is planned and when it is due. Define who develops and maintains the Product Breakdown Structure.) 4.4 Requirements Identification and Analysis (Define who develops the requirements hierarchy, define who is responsible for each part of the hierarchy, define who identifies and is responsible for the crosscutting requirements. Define when requirements identification is due and when formal configuration control is expected to start.) 4.5 Validation and Verification (Define who is responsible for the validation and verification activities and how this is accomplished.) 4.6 Interfaces and ICDs (Define which ICDs are planned, what interfaces are to be included, who is responsible for developing the ICDs and who has approval and configuration management authority.)
4.7 (Define the applicable mission environments, who is responsible for determining the mission specific environmental levels or limits, and how each environmental requirement is to be documented.) 4.8 Resource Budgets and Error Allocation (List the resource budgets that Systems Engineering will track, and when they will be placed under formal configuration management.) 4.9 Risk Management (Define who is responsible for defining acceptable risk and where this is documented. Define the role of systems engineering in risk management and how the analysis are to be accomplished.) 4.10 System Engineering Reviews (Define which system engineering reviews are planned and who is responsible for organizing them.) 5. Configuration Management (Define what systems engineering documentation is required and when it is to be placed under formal configuration management. Define the method to archive and distribute System Engineering information generated during the course of the lifecycle.) 6. System Engineering Management (Define the Systems Engineering Organization Chart and Job Responsibilities. Define trade studies, who does them and when they are due.) AUSSP. (2007). AubieSat-1: Auburn's First Student-Built Satellite. NASA. (1995). NASA Systems Engineering Handbook, SP-610S: PPMI. NASA. (2002). Systems Engineering GPG 7120.5. from http://spacecraft.ssl.umd.edu/design_lib/GPG7120.5.pdf NASA. (2007). Systems Engineering Handbook, NASA/SP-2007-6105 Rev1NASA Headquarters, Washington, D.C., 20546. |
||||||||||||||||||||||||||||||||||||||||||||||||||||||||||||||||||||||||||||||||||||||||||||||||||||||||||||||||||||||||||||||||||||||||||||||||||||||||||||||||||||||||||||||||||||||||||||||||||||||||||||||||||||||||||||||||||||||||||||||||||||||||||||||||||||||||||||||||||||||||||||||||||||||||||||||||||||||||||||||||||||||||||||||||||||||||||||||||||||||||||||||||||||||||||||||||||||||||||||||||||||||||||||||||||||||||||||||||||||||||||||||||||||