- Spring 2022
Density Profiling System Evaluation
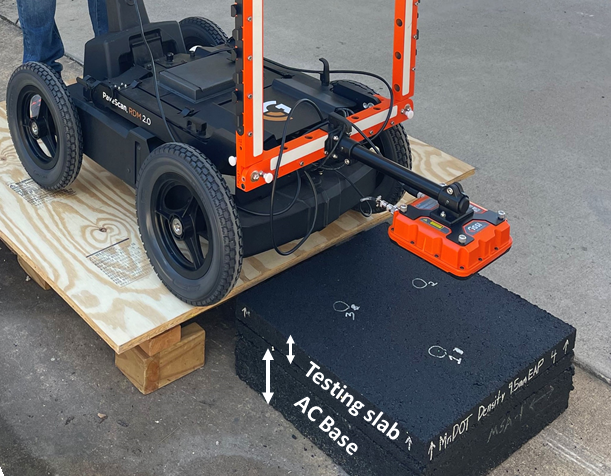
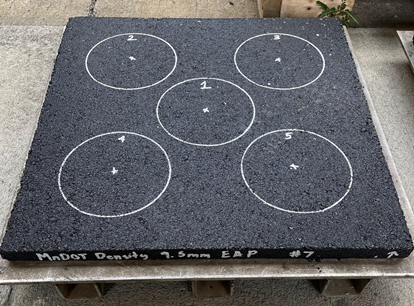
Slab test configuration and locations.
Ground-penetrating radar (GPR) is a non-destructive testing technology that’s been used for years to determine the thickness of pavement layers. Several recent studies have shown that GPR can also evaluate the in-place density of a pavement in a continuous manner, providing a better measure of the uniformity of compaction operations. However, research on these new density profiling systems (DPS). was needed to examine the effect of the thickness of the evaluated layer and the type of material underneath on the density results.
As part of a national pooled fund study (Pooled Fund TPF-5 [443]), NCAT evaluated the effect of thickness in the laboratory and evaluated the effect of the base material by placing and testing 2ft by 2ft compacted slabs on two asphalt pavements, one concrete pavement, and steel plates. Steel was used to have significant contrast with respect to typical pavement materials.
This evaluation also included field testing on several pavement sections built in 2021 as part of the NCAT Test Track’s eighth cycle. Four slabs of varying thickness were compacted using two unmodified plant-produced asphalt mixtures with nominal aggregate maximum sizes (NMAS) of 9.5 mm and 19.0 mm. The 9.5 mm mixture was fine-graded and the 19.0 mm was coarse-graded. Target air voids of the slabs were set to 7.0% and five different locations of the slabs were selected to measure dielectric values with three replicates per location.
For the thin compacted slabs of both mixtures (0.9-inch for the 9.5 mm mixture, 1.8-inch for the 19.0 mm mixture), the average dielectric values were higher on steel than the other base materials. Thin surface layers over underlying asphalt layers provided the lowest readings. However, for thicker surface layers (1.8 inch for the 9.5 mm mixture and 3.0 inch for the 19.0 mm mixtures), the effect of the underlying layer type was not significant.
Field testing included six 100-ft sections built on the exit ramp of the NCAT Test Track. The sections had different base layers with a common hot mix surface lift approximately 1 inch thick. Five of the base layers were cold recycled mixtures using different additives: foamed asphalt, straight emulsion, soy based emulsion, a rejuvenator, and rejuvenated emulsion. The surface lift was a dense graded 9.5 mm NMAS mixture with a PG 67-22 asphalt binder and 20% RAP. The target air void content for the asphalt mixture was 6.0% or 94% of Gmm. Figure 1 shows an air voids map with several measured density profiles. High variability (poor uniformity) in air voids can be observed with values ranging from 0.0% to 15%.
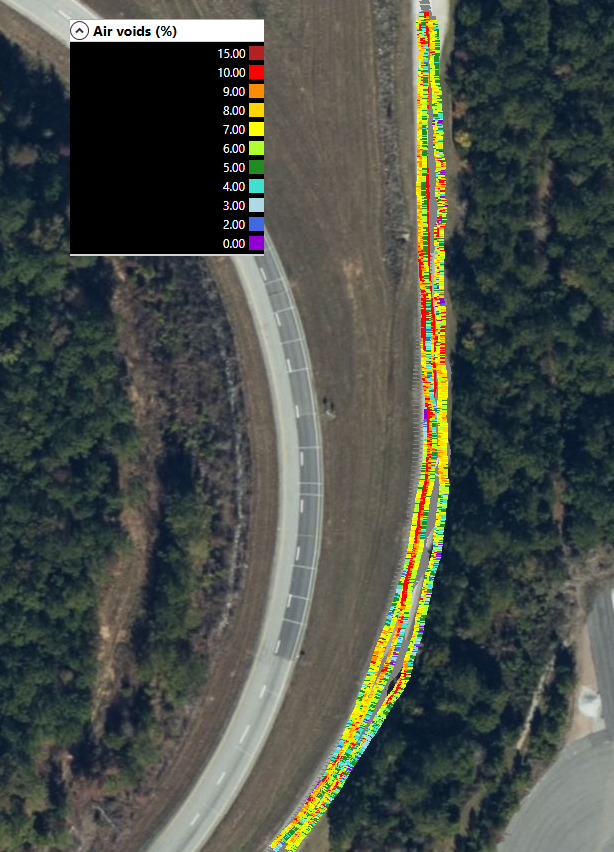
Figure 1. Computed Air Voids from Density Profiles – Ramp Sections
Table 1 shows the summary of the compaction level and percent within limits (PWL) analyses performed on each section. A typical range of 92 to 99% was used as limits for the analyses. Table 1 shows that most of the percent defective (PD) results were below the lower limit. The control section with the HMA lower layer had the highest PWL; the remaining sections with cold recycled asphalt lower layers had significantly lower PWL. Since the surface layer was thin (1.0 inch), the measured dielectric values were affected by the lower layer. Particularly, the presence of water in the underlying cold recycled layers will influence the dielectric values.
Table 1. Compaction Analysis – Ramp Sections
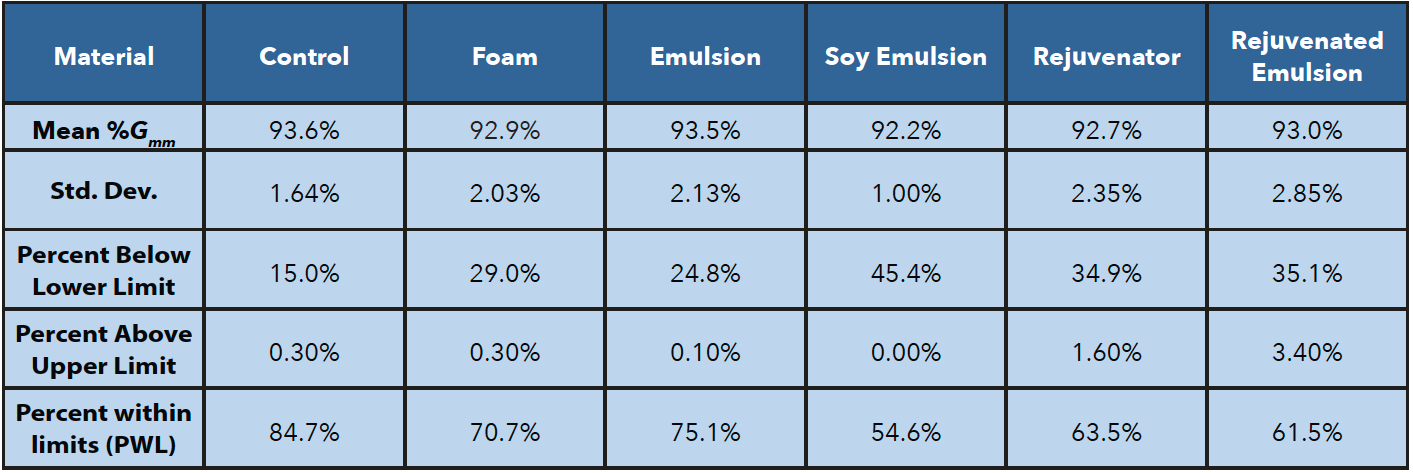
Table 2 shows a summary of the compaction level and percent within limits (PWL) analyses performed on sections built on the NCAT Test Track in 2021. Of these test sections, lower average compaction levels and lower PWL results were obtained for sections with thin lifts (≤ 1.5 inch). Sections with thicker asphalt surface layers not only had higher densities and PWL results, but also were more uniform. Figure 2 shows a compaction level map of Section N7 with the majority of the results obtained within a small range.
Table 2. Compaction Analysis – Test Track Sections
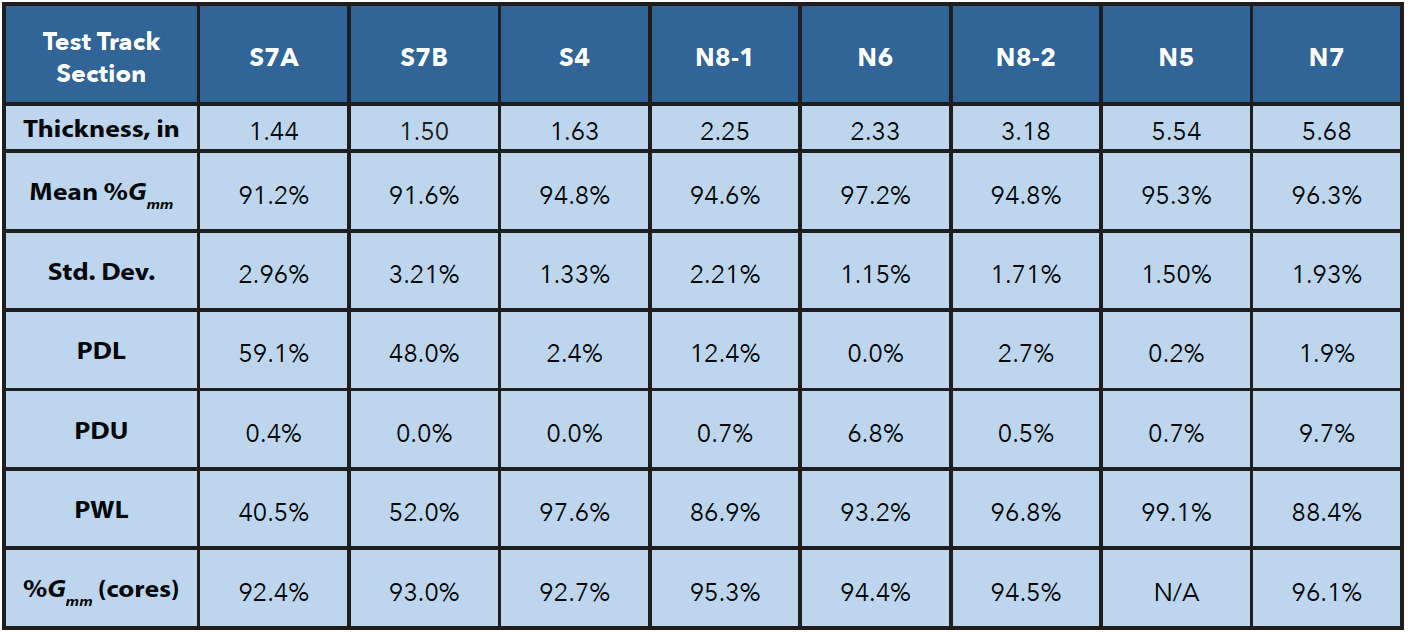
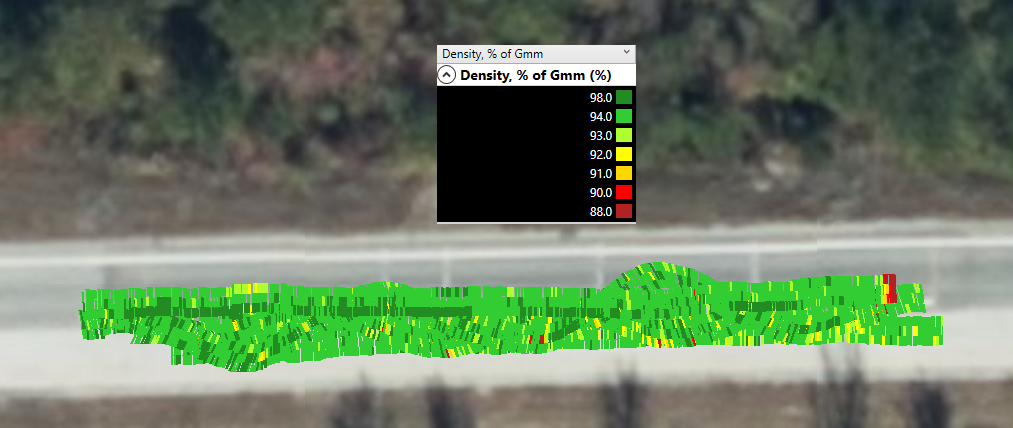
Figure 2. Compaction Level from Density Profiles in Section N7
The following conclusions and recommendations are based on the results of this study:
- - Thin layers (less than 2 inches) may be affected by the base materials with significantly different dielectric values compared to asphalt pavement.
- - Thin asphalt layers over cold recycled layers are highly affected by the presence of water in the underlying layer, causing greater variability and the likelihood of poor density profiles. This issue is expected to occur for any underlying layer containing moisture.
- - Measured air voids of thick asphalt layers tend to have lower variability and higher percent conforming.
- - Dielectric and density evaluation of the existing surface prior to the construction of thin lifts is recommended to help explain the measured variability of such thin layers.

For more information about this article, please contact Fabricio Leiva.