- Fall 2019
Preliminary Results from NCAT Performance Test Round-Robin
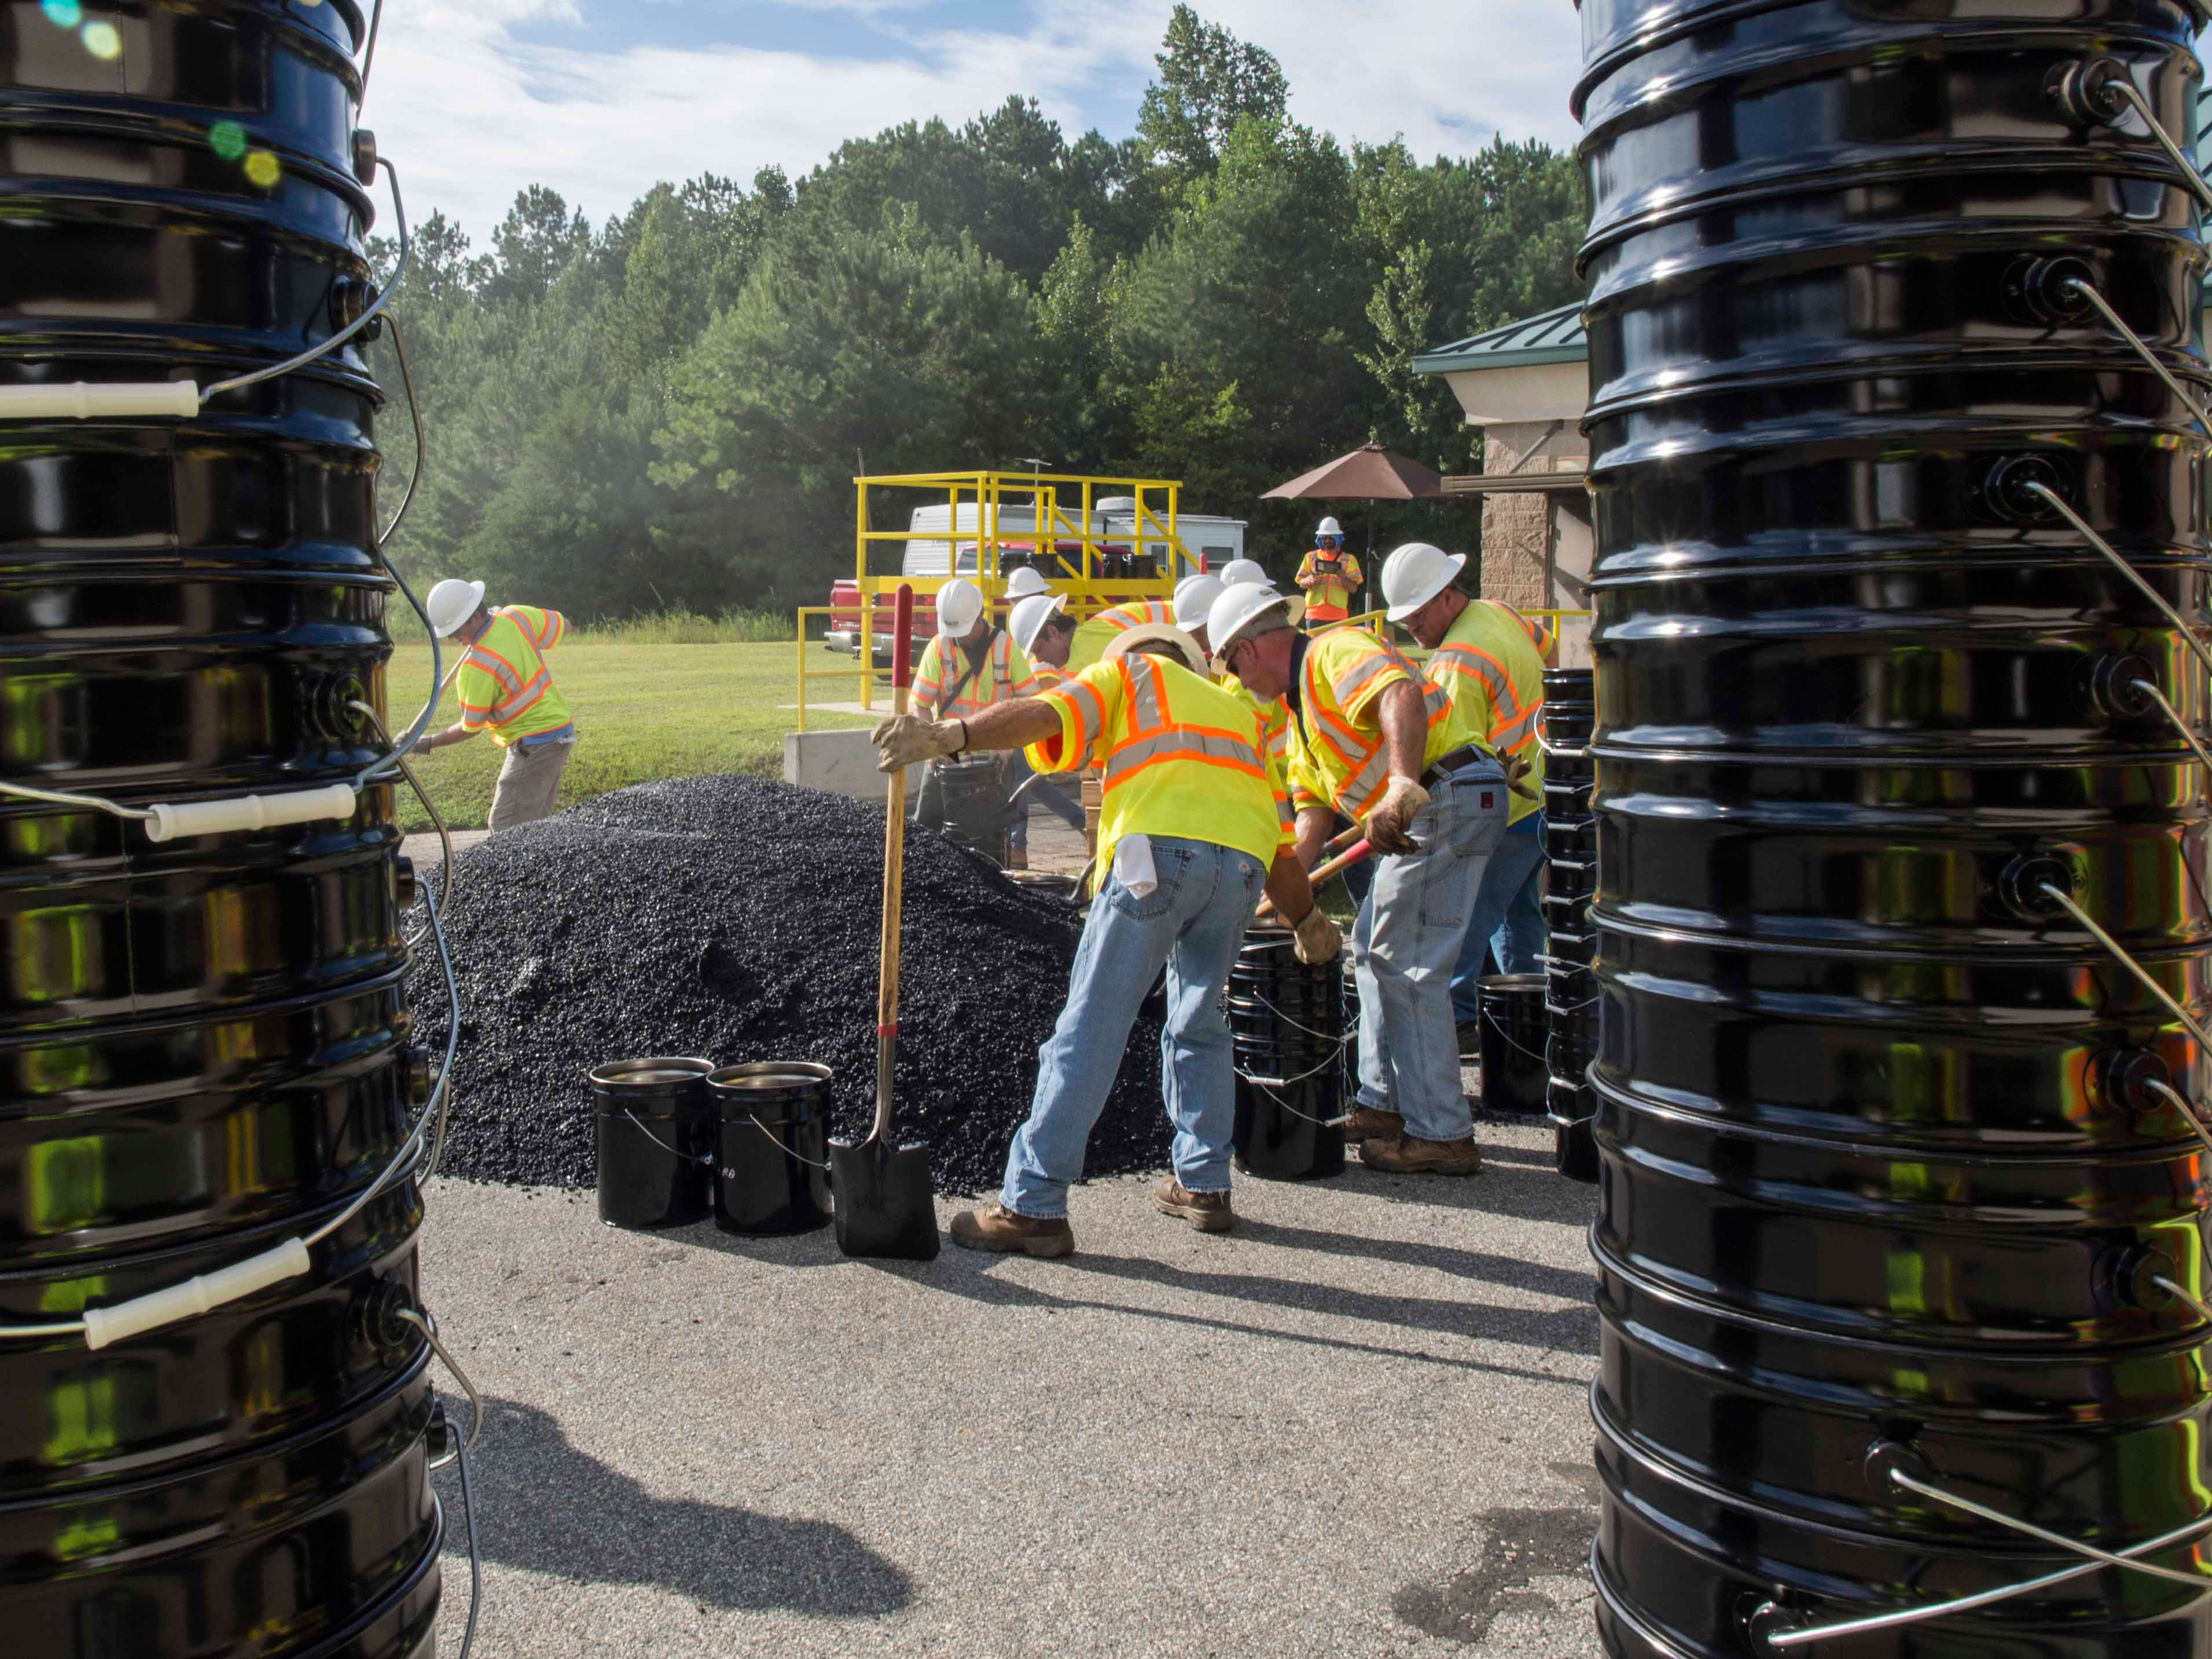
Two hundred five-gallon buckets of asphalt mix were sampled during 2018 Test Track construction for the round-robin study.
In 2018, NCAT initiated a round-robin study for mixture performance tests being considered for balanced mix design (BMD) implementation. Over 40 labs participated in the round-robin study with an interesting cross section of state DOTs, contractors, consulting firms, materials suppliers, and even a few international labs. Each lab selected the tests that they wanted to perform. The most popular tests were the Hamburg Wheel-Tracking Test (AASHTO T324-17), the Illinois Flexibility Index Test or I-FIT (AASHTO TP 124-18), the Asphalt Pavement Analyzer or APA (AASHTO T340-10), and the Ideal Cracking Test or Ideal-CT (now ASTM 8225-19).
The study had two main objectives. The first was to give labs that are new to mix performance tests a chance to gauge their results compared to results from other labs. The second objective was to generate information on within-lab and between-lab variability of the tests.
After determining the quantity of mix needed for the study, NCAT staff sampled a single plant-produced mix produced for an experiment on the NCAT Test Track. Two hundred five-gallon buckets of mix were sampled from a hot stockpile of asphalt that had been passed through a material transfer vehicle. The mixture was a 9.5 mm NMAS mixture containing PG 64-22 binder with no polymer or rejuvenator modification. The mixture had an intermediate reclaimed asphalt pavement (RAP) content and was designed using a BMD process. The BMD mix was desired so that reasonable values of rutting and cracking parameters could be obtained from the round-robin testing.
For the first phase of the study, detailed instructions were sent to the participating labs along with enough mix needed for conducting the performance tests they selected. The participating labs then fabricated and tested specimens and sent a data summary along with a copy of the raw data files to NCAT for compilation and analysis.
At this point, all results from Phase 1 have been received. Draft summary reports have been provided to the participating labs for the Hamburg, Ideal-CT, and I-FIT test, and the APA report is currently being prepared. Table 1 summarizes the between-lab variabilities for the Hamburg, I-FIT, and Ideal-CT.
Table 1. Summary of Between-Lab Variability Information from the First Phase of the Round-Robin Study
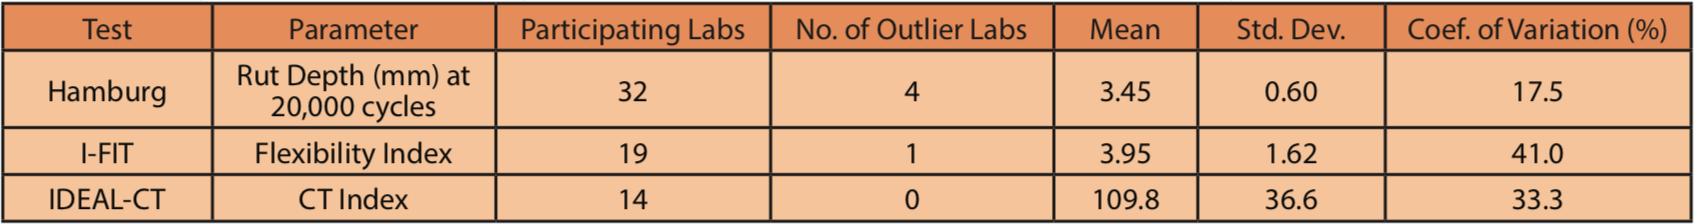
For the Hamburg test, four labs reported results that were determined to be outliers. Outlier labs were identified using a standard Boxplot analysis. In these four cases, the reported rut depths were significantly higher than the results from the other 28 labs. Excluding the four outlier lab results for the Hamburg test yielded a coefficient of variation (COV) of 17.5%, which is a reasonable measure for repeatability among participating labs.
For the I-FIT results, only one lab was identified as an outlier, but the between-lab COV was 41%, which is the same as reported by the Illinois DOT in their most recent round-robin. The higher variability for the I-FIT was driven by a handful of labs that reported very high COVs for their within-lab results. For the Ideal-CT, no outlier labs were identified and the between-lab COV was 33%.
After the first phase of the study, there was enough of the sample mix remaining to conduct a second phase for the I-FIT and Ideal-CT. The objective of the second phase of the study is to evaluate how much of the variability is related to sample fabrication and how much is related to testing in the different labs. To accomplish this, I-FIT and Ideal-CT specimens were fabricated at NCAT, taking care to prepare the specimens as uniformly as possible. The fabricated specimens were randomized based on air voids so that each lab would receive a set of samples with approximately the same average air void content. These specimens were then packed and shipped to the participating labs.
The phase two results for the Ideal-CT have been received from all of the participating labs. In this phase, the between-lab mean CT Index was 103.7, the standard deviation was 11.5, and the COV was 11.1%. These results reveal how much effect sample fabrication has on variability. In the case of the Ideal-CT test, the COV was reduced from 33.3% to 11.1% from Phase 1 to Phase 2, indicating that differences in sample fabrication from lab to lab contributed to two-thirds of the overall between-lab variability of the test. This is an important finding that emphasizes the need for thorough hands-on training as part of implementation plans for performance tests used in mix design or production testing.
NCAT continues to finalize the initial reports for the first phase and will provide further details to each participating lab this fall. Further analysis of Phase 2 also continues as additional labs report their results. Another planned aspect of analysis is to examine how results may be affected by the make and model of the test equipment. Another round-robin is being considered that may involve other mixtures and additional video-based training on sample fabrication and testing.

For more information about this article, please contact Adam Taylor.