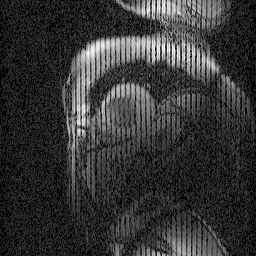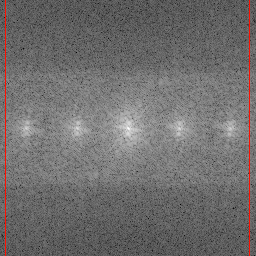

| The data acquired from a magnetic resonance scanner is complex valued frequency domain data, and must be converted to a visual image by use of the inverse Fourier transform. Because the image is real valued, any imaginary components in the data can be assumed to be due to noise, and as long as the noise is a relatively small part of the total signal, a good image reconstruction can be managed simply by using the magnitude of the image and discarding the phase components. This produces an image, such as the one here. |

|

|
In order to begin working with the image, a measure of the noise variance in the image needs to be found. This can be done most simply working with the image in the frequency domain. The noise present in the image can beassumed to be white, meaning that is possesses energy at all frequencies, unlike the information present in the actual image. The trick then becomes finding the place where most of the signal in the image can be attributed to noise as opposed to valid MRI information. Since most of the information in the image in concentrated in the lower frequencies, the border region at the uppermost frequencies (marked by the lines) is used to determine the variance of white noise in the image. |
A collection of images acquired from a single subject is called a study, which in turn, consists of a series of images in time (from ten to twelve) as well as a series of stacked slices (6 or so) which provide imaging of the heart in all three spacial dimensions, as well as the time dimension (roughly 300ms). It is worth noting here that each image is an average of several systolic heartbeats taken while the patient was holding his/her breath. This averaging, as well as the breath holding, helps reduce noise artifacts in the images. The averaging affect also functions to average the dispacement forces in the ventricle, resulting in a more consistent image, as the three dimensions of tagging (horizontal and vertical on the short axis, and horizontal on the long) must be imaged at different times.
A complete series of images taken from a single slice is available. However, it is a rather large download. These images are of the left ventricle, which is of most concern during an ischemic event, since it pumps blood out to the body through the aorta. This view shows the ventricle from above, at a slightly oblique angle. It appears as the white, moving circle at the center of the image. Notice several things in the image: Firstly, the taglines deform with the motion of the heart, and secondly, the taglines and blood fade as the frames progress due to a phenomenon called T1 relaxation.
| The only step in processing these images in which we are not currently working to elimiate human intervention is that of selecting the region of interest (ROI), or the area of the image in which the ventricle is located. Care must be taken at this point so that the ventricle does not translate out of the region of interest at any point in the image stack or in any part of the time series. A selected region of interest is shown here to the right. |  |
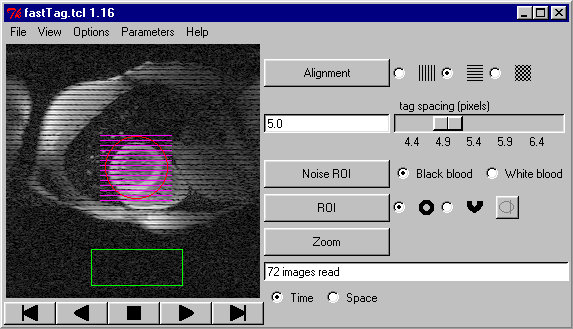
Finally, the inital tag line positions are determined. This is currently done with user supervised processing, but we
are working a totally automated method. The image below shows a small program developed to perfrom
these preperation steps on the image. As you can see, the ROI has been selected. In this
case, the image has been tagged horizontally to allow measurement of motion in different
vector direction.
