Guide to Monte-Carlo Analysis using PSPICE
This follows Example 5.14 from Microelectronic Circuit Design, 2nd Ed. (Jaeger).
For details of Monte-Carlo analysis refer to Chapt. 13 of the "MicroSim PSpice A/D & Basics Users Guide." This is available at (among other sources):
http://www.ece.uncc.edu/manuals/
We want to perform Monte-Carlo (MC) analysis on a BJT four-resistor bias circuit with a 5% tolerance on VCC, 10% tolerance for each resistor, and 50% tolerance on the current gain bF = 75.
PSPICE will be used to determine the nominal values, as well as the statistical distribution of IC and VCE.
In order for PSPICE to perform a MC analysis, the parts that have tolerances must have models.
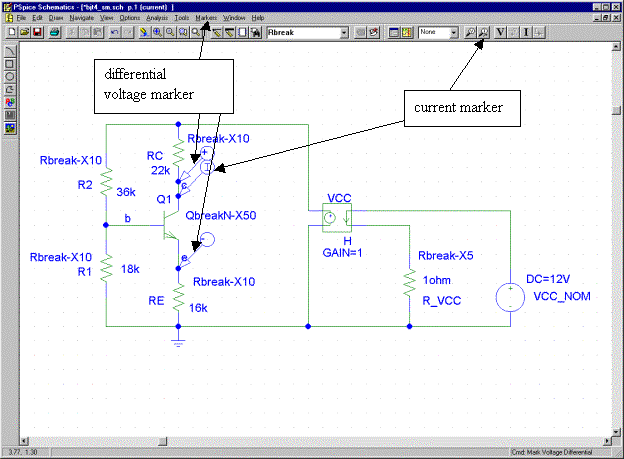
We start by constructing the circuit using Rbreak parts for the resistors, instead of R parts.
We will use a QbreakN part for the BJT.
We need to play a "trick" to be able to put the 5% toelrance on VCC, since voltage sources don't have models associated with them. We will generate the voltage VCC with a current-controlled voltage source (H part), for which the control current comes from a fixed 12 V source in series with a 1-ohm nominal Rbreak part. Then we can impose the desired 5% tolerance on the Rbreak, and Ohm's law will do the rest for us.
The finished circuit is shown below:
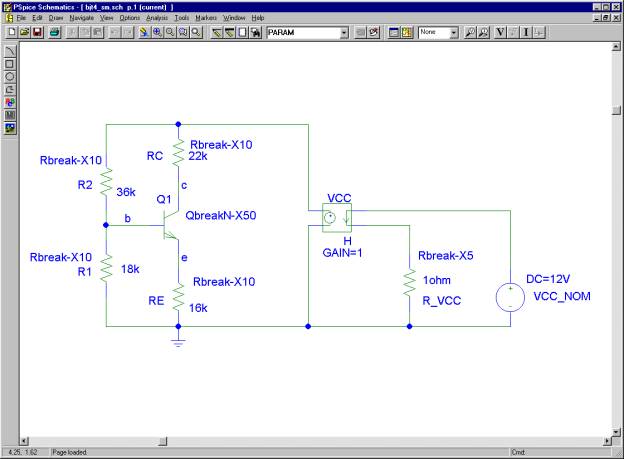
I edited the model names to help remind me of the tolerances. Rbreak-X10 has 10% tolerance, QbreakN-X50 ahs 50% tolerance, and Rbreak-X5 has 5% tolerance.
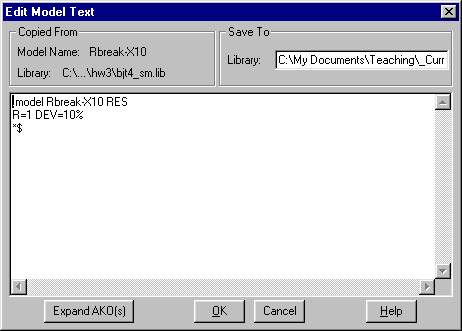
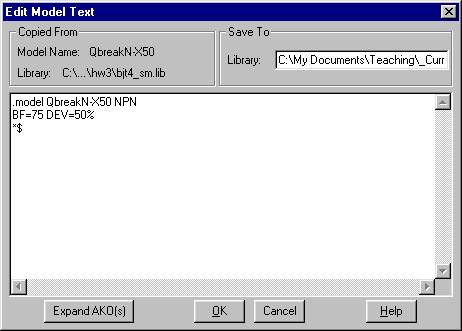
Let's look at the models (access these by selecting the part with the mouse, then choosing Edit / Model / Edit Instance Model):
The Rbreak-X10 model is shown below. Notice the R=1 DEV=10% statement, which tells PSPICE that this part has a nominal value of 1 ohm (which gets multiplied by the actual resistance you set on the schematic), and a device tolerance. (There is also something called a lot tolerance which can be specified, but we're not using that here.):
The Rbreak-X5 model is shown next; notice the DEV=5% statement:

Finally, the BJT model is shown; notice the BF=75 DEV=50% line, which tells PSPICE the nominal value of BF is 75, and the device tolerance is 50%.
In order to display the nominal resistance value on the schematic for an Rbreak part, follow these steps:
(1) Double-click the part on the schematic to bring up the dialog box:
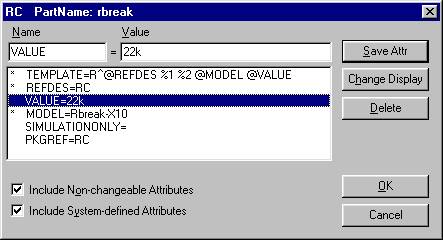
(2) Select and edit the line VALUE = (as shown above).
(3) Click on the Change Display button to get this box:
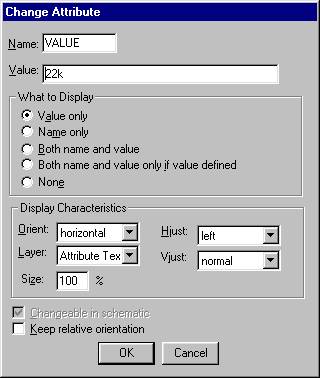
(4) Choose Value Only
(5) Click OK, OK.
Now the nominal value will show on the schematic, and can be edited directly by double-clicking.
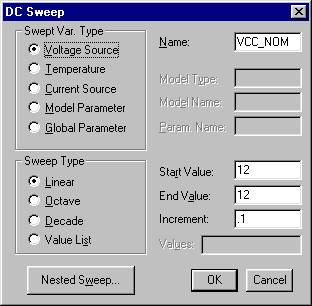
To run the MC analysis, we need to set up the DC Sweep and MC parameters. Using Analysis / Setup, set up the DC Sweep as shown:
and setup the MC box as follows:
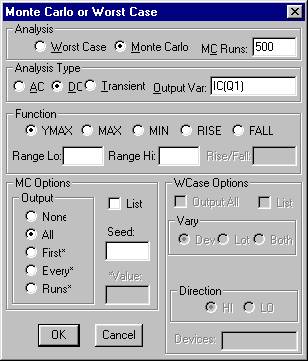
(The Output Var entry determines which detailed results are written to the output file; but it does not affect the histogram.)
To get the MC analysis histogram results for IC and VCE, place a current marker on the collector fo the BJT, and a differential voltage marker (Markers / Mark Voltage Differential) between the collector and emitter terminals, as shown below.
and run the simulation (select Anlaysis/ Simulate, press F11, or click the toolbar icon).
If PROBE is set to auto-run (Analysis / Probe Setup), you should get a histogram for one of the desired variables (IC or VCE). In order to get a histogram for the other variable, double-click the variable name and select or type in the new one. One expression for VCE that PSPICE will understand is (watch punctuation marks):
V(Q1:c, Q1:e)
-assuming node labels c and e are used as shown in the example schematic above.
The expression for IC is:
IC(Q1)
You should get a histogram similar to this:
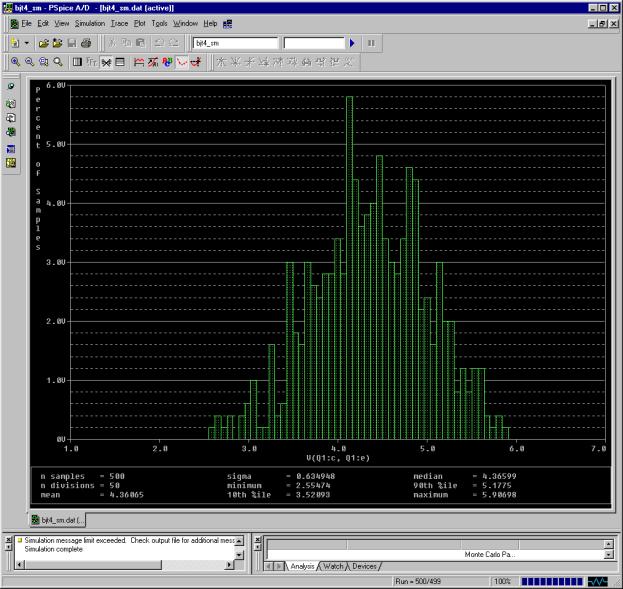
To change the number of histogram bins (shown as n divisions on the plot legend), select Tools /Options / Number of Histogram Divisions and enter the desired number.
Note: Due to a bug in PROBE, the units (A or V) shown on the vertical axis are erroneous, but the text label "Percent of Samples" is correct.